In every career, there are defining moments. They’re rarely the easy wins; more often, they are the complex, high-stakes challenges that test your skills, your resilience, and your ability to lead. For me, one such moment came shortly after I joined a new company, when I was handed a project that was not just stalled, but spectacularly failing.
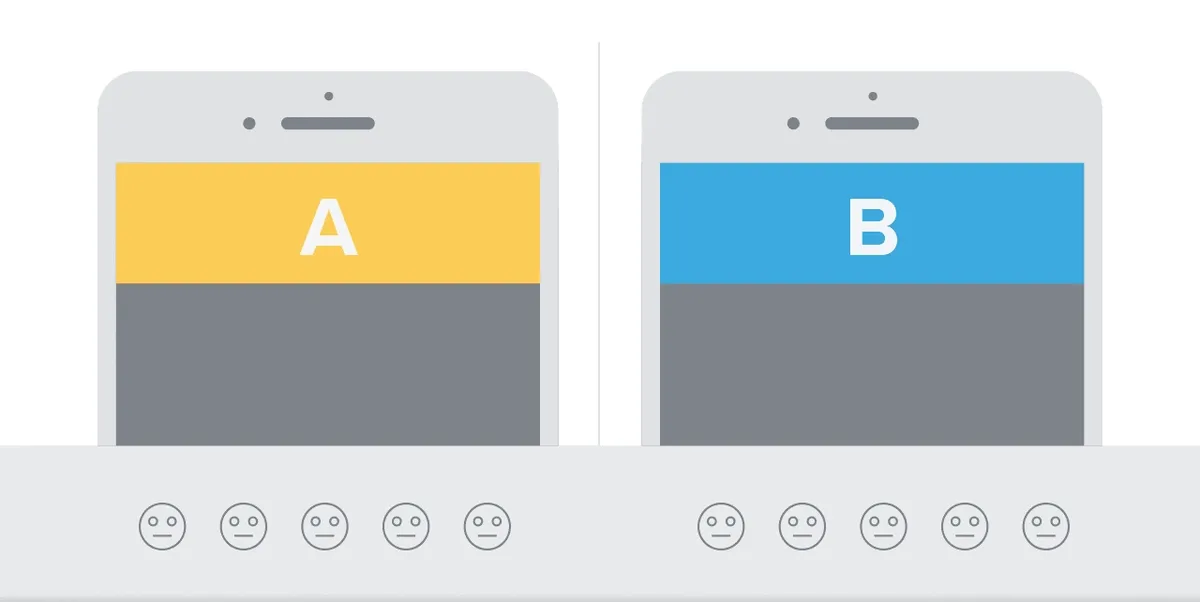
The project was the A/B test for our new desktop listing page—a cornerstone of a massive, company-wide initiative to modernize our technology stack. But instead of proving the value of our new microservices architecture, the test was showing an alarming 30% drop in user click-through rates. The project was stuck, morale was low, and a multi-million dollar strategic initiative was at a complete standstill. No one could figure out why.
This is the story of how we diagnosed the root cause, navigated a critical disagreement with senior leadership, and ultimately turned a failing project into a catalyst that strengthened our entire experimentation culture.
Chapter 1: The Investigation – Diagnosing a Silent Failure
My first task was to understand the ‘why’. The prevailing theory was that there must be a subtle bug or latency issue in the new tech stack. But my gut told me it was something more fundamental. I decided to go back to first principles and scrutinize the experiment’s methodology.
An A/B test, at its core, is a scientific experiment. To get a valid result, you can only change one variable at a time. This test was intended to be a simple “apples-to-apples” comparison of the old technology versus the new, with the user experience (UX) remaining identical.
However, after a meticulous side-by-side comparison, I discovered the flaw: to save time during development, several undocumented UX changes had been introduced to the new version of the page. The button to contact a seller was a different color and in a slightly different position. The navigation bar was altered. The layout of related items had changed. We weren’t just testing a new engine; we were testing a completely different car.
This meant our test was confounded. We had no way of knowing if the 30% drop in engagement was due to the new technology or the myriad of design changes. To solve this, I launched a full audit. I created a detailed spreadsheet, my “Rosetta Stone,” that documented every single difference, no matter how minor. This document would become the single source of truth that brought clarity to the chaos.
Chapter 2: The Pitch – From Audit to a Business Case
Armed with this clear evidence, I needed to persuade the Product Director to halt the project and dedicate engineering resources to fix the design discrepancies. I knew a simple technical explanation wouldn’t be enough; I had to frame the decision around his biggest pain points. My approach was to present a clear, data-driven business case.
The Core Problems We Faced
My pitch focused on three issues created by the flawed test:
- A Blocked Strategic Initiative: The most critical point. Our multi-million dollar tech modernization was at a complete standstill. Every week of delay was another week we couldn’t build new features on the new platform, representing a massive opportunity cost.
- Total Data Ambiguity: The 30% drop in click-through rate was a terrifying and useless metric. We had no way of knowing if our new tech was a catastrophic failure or if minor UX changes were the culprit. We were flying blind on a mission-critical project.
- The Risk of a Flawed Launch: The Director’s suggestion to “launch and iterate later” was a huge gamble. If we launched now, we would be pushing potentially revenue-damaging UX
The Business Case: A Small Investment for a High Return
I presented the decision not as a delay, but as a cost-benefit analysis.
- The “Cost” (Our Ask): “I’m asking for a small, one-time allocation of engineering time—likely less than two sprints—to fix the documented UX discrepancies and achieve a true ‘apples-to-apples’ test.”
- The “Benefit” (The Return on Investment):
- De-risking the Initiative: “This investment gives us certainty. It allows us to validate our new technology stack without ambiguity, unblocking the entire company’s product roadmap for the next two quarters.”
- Protecting Revenue: “That 30% drop in engagement isn’t just a number. If even a fraction of that is caused by the UX flaws, launching now could represent a potential revenue loss of X million dollars annually. This upfront work is an insurance policy against that loss.”
- Gaining Actionable Insights: “A clean test will give us a clear baseline. From there, we can test the new UX changes one by one, allowing us to learn and iterate effectively instead of making a blind, high-risk decision.”
By framing the conversation this way, the choice became clear. We weren’t choosing between “delay” and “progress.” We were choosing between “a small, predictable investment” and “a massive, unpredictable risk.”
Chapter 3: The Turning Point – A Legacy of Trust
The outcome was a complete turnaround. By grounding the disagreement in a clear business case and speaking the language of risk mitigation, the Director’s perspective shifted. He went from seeing me as a blocker to seeing me as a strategic partner.
He approved the engineering resources that same day. We fixed the design flaws, launched a clean A/A test that passed with neutral metrics, and successfully unblocked the entire company’s tech migration. This unleashed the product roadmap for the next two quarters.
But the impact went far beyond just one project.
Operationally, my audit spreadsheet became a “pre-flight checklist” used by other teams to prevent similar issues, saving countless hours of rework.
Culturally, our data-driven approach to resolving the disagreement became a case study within the company. It established a new, healthier precedent for how Product and Analytics could collaborate—not as adversaries, but as partners focused on a shared goal.
That project taught me a crucial leadership lesson: the most complex problems are rarely solved by data alone. They are solved by using data to build a shared understanding, to translate technical complexity into business clarity, and to turn moments of conflict into opportunities for collaboration and trust.